23 June 2026
AI unwind goes global — KOSPI crashes, Nasdaq slides 2%, gold under pressure
The current week in the financial markets has been dominated by a sharp reversal in the AI-and-semiconductor trade that had powered equity gains through the first half of 2026. What began as modest profit-taking in US tech names quickly spiralled into a full-scale risk-off episode in Asia, culminating in the largest single-day decline in KOSPI history on Tuesday, June 23. Wall Street followed on the same day, with the Nasdaq falling roughly 2%, while gold extended its decline as a stronger US dollar and rising real-yield expectations reduced the appeal of non-yielding assets.
The selloff does not yet mark a confirmed trend reversal — the Nasdaq remains up about 10% year-to-date and roughly 5.5% below its record high set on June 2 — but it has exposed the fragility of a market structure built on extreme concentration in AI-linked names, leveraged retail products and algorithmic momentum flows.
KOSPI: a record crash the day after an all-time high
South Korea's benchmark KOSPI suffered its steepest one-day drop on record on Tuesday, closing at 8,203.84 — down 910.71 points, or -9.99% — just one session after hitting an all-time high. A circuit breaker halted trading for 20 minutes after the index fell more than 8% from the prior close, marking the fourth such suspension this year and the tenth in the exchange's history.
The collapse was driven almost entirely by the semiconductor complex. Samsung Electronics fell -12.31% and SK hynix dropped -12.47%, their sharpest declines in 17 years. Together with SK Square and Samsung Electro-Mechanics, the top four chip names account for roughly 61.7% of the KOSPI — an extreme concentration that amplified the correction far beyond what the underlying macro news would normally justify.
Several factors converged to trigger the panic:
- Leveraged ETF unwind: Single-stock leveraged products tied to Samsung and SK hynix — which had gained massive popularity among retail investors — recorded average losses of -24.6% and -25.6% respectively, forcing systematic rebalancing and margin-call liquidations.
- Regulatory warning: The head of the Financial Supervisory Service publicly expressed regret over approving these leveraged products, adding to retail panic.
- Foreign selling: Foreign and institutional investors combined offloaded roughly 8.7 trillion won, overwhelming a record 8.5 trillion won of retail buying.
- Spillover from Wall Street: Nasdaq futures and US chip stocks had already weakened on Monday, setting the stage for Asia's reaction.
Remarkably, the KOSPI had risen more than 90% year-to-date before the crash — making it the world's best-performing major equity market in 2026. Analysts at Mirae Asset Securities and others predominantly described the move as a technical breather rather than a structural trend reversal, with some forecasts still pointing toward the 10,000 level over the medium term.
On Wednesday, June 24, the index staged a partial recovery, closing +3.26% at 8,471.02, helped by reports that Samsung may announce a 90 trillion won share buyback programme. Samsung itself surged nearly 10% on the day, though SK hynix lagged with a modest +0.98% gain — a sign that the rebound remains uneven and sentiment fragile.
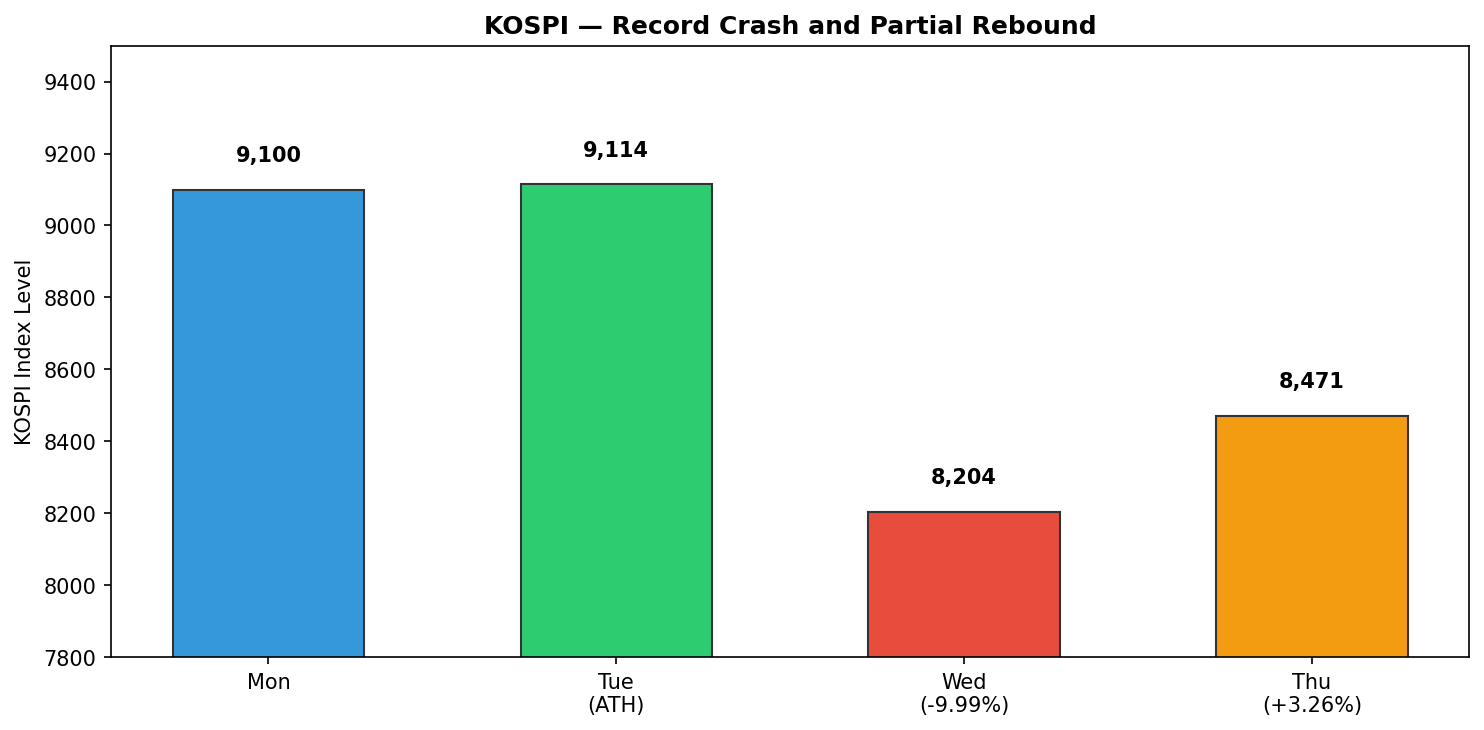
KOSPI — record crash and partial rebound, June 23–24, 2026. Source: Korea Exchange
VKOSPI (Korean volatility index). Source: Korea Exchange
Nasdaq: a second day of selling extends the AI correction
US markets entered the week already under pressure. The Nasdaq Composite fell -1.32% on Monday as investors began questioning whether AI-linked valuations had run too far, too fast. Tuesday's session extended the decline, with the Nasdaq dropping a further -2.21% — its worst day in about two weeks — while the S&P 500 fell -1.44% and the Dow was nearly flat at -0.1%, reflecting its lower tech exposure.
The selling was concentrated in semiconductor and AI infrastructure names. A closely watched US semiconductor gauge — which had more than doubled from its war-driven lows earlier in the year — lost approximately 8% on Tuesday alone. The cascade from Seoul to New York illustrates how tightly correlated global chip equities have become in the current AI cycle.
Despite the two-day slide, the broader picture remains constructive on a year-to-date basis. The Nasdaq is still up roughly 10% in 2026 and sits only **~5.5% below its June 2 record high. The correction, so far, resembles the periodic air pockets that have punctuated the AI rally over the past 18 months — sharp, headline-driven and often followed by dip-buying once the initial panic subsides.
That said, rising expectations for additional Fed rate hikes — flagged by BofA and Deutsche Bank forecasts — add a macro headwind that prior AI corrections did not face. Higher discount rates compress the present value of long-duration growth assets, making the current selloff potentially more durable if inflation data due later this week confirms sticky price pressures.
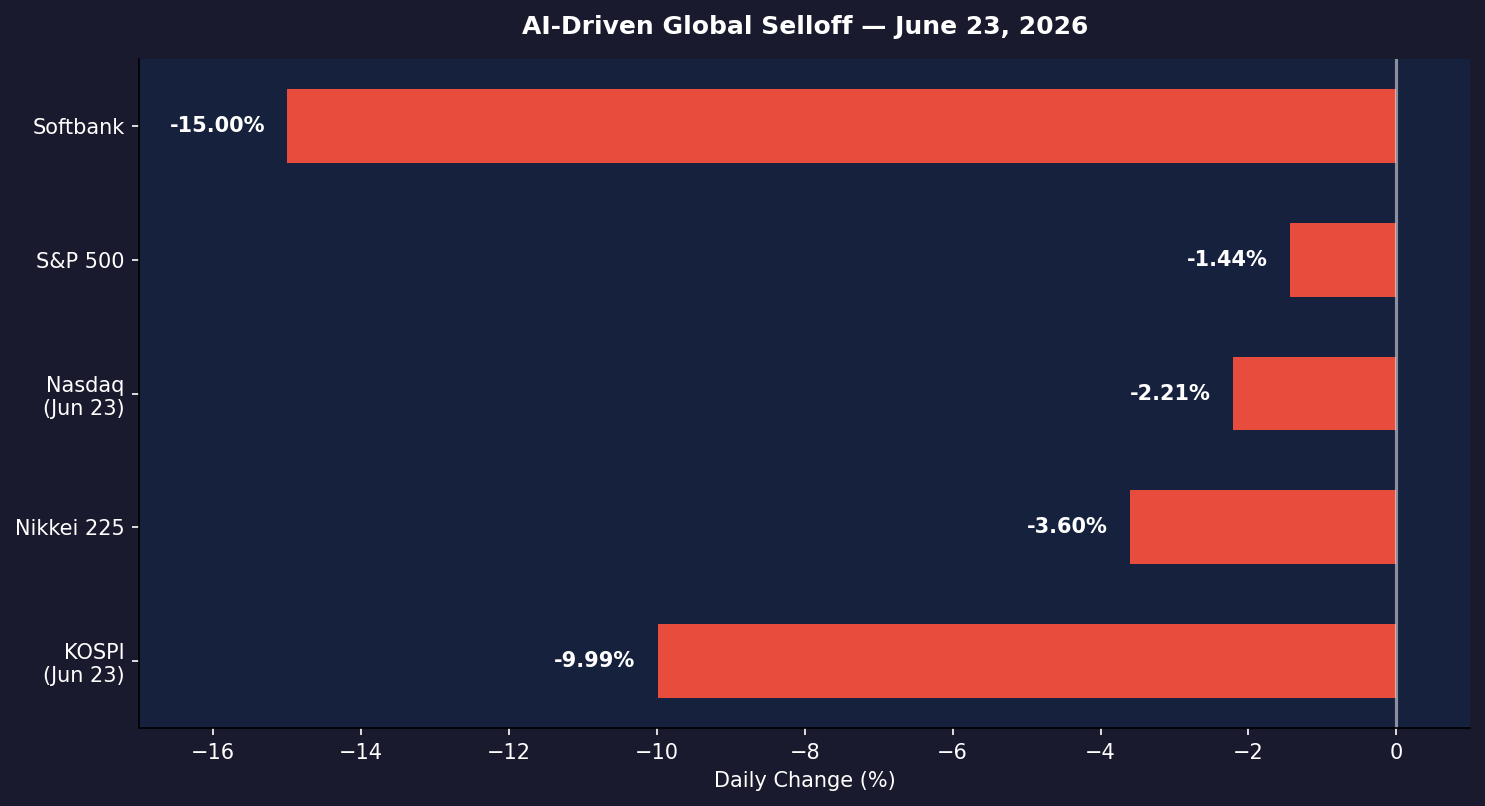
Global AI-driven selloff — June 23, 2026. Source: market data
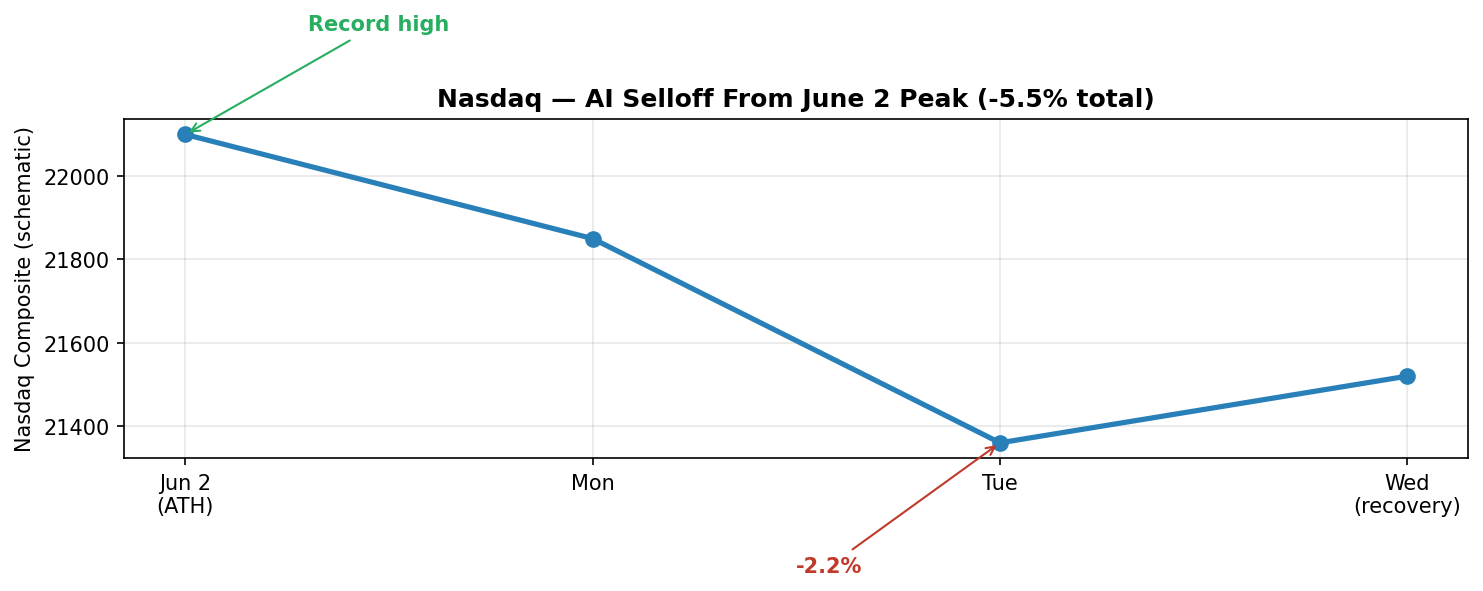
Nasdaq Composite — selloff from June 2 record high. Source: Exness.com
Gold: post-Fed highs fade as the dollar strengthens
Gold (XAU/USD) has been moving in the opposite direction to its early-June highs, extending a decline that accelerated after the Federal Reserve's June meeting. The metal has retraced from the $4,350 area — where it traded in the immediate aftermath of the Fed decision — toward the $4,120–4,125 zone, which now functions as the primary support and participation area.
The driver is a familiar chain: hawkish Fed repricing → higher Treasury yields → stronger US dollar → lower gold. With markets shifting attention from the Fed meeting itself toward upcoming Core PCE and final GDP data, gold is increasingly trading as a barometer of whether inflation persistence and growth resilience will validate the higher-for-longer rate path.
Gold fell for a second consecutive day during the tech-led equity selloff, as investors cut bullion holdings to cover losses elsewhere — a classic sign of a cross-asset deleveraging episode rather than a gold-specific fundamental shift. Brent crude also eased, slipping below $77 per barrel as tanker traffic through the Strait of Hormuz normalised following an interim US–Iran agreement, removing another pillar of the geopolitical hedge bid.
Resistance for gold has developed in the $4,175–4,200 area, while support is concentrated around $4,100–4,125. A break below $4,100 would open the path toward $4,050, particularly if Thursday's Core PCE print surprises to the upside. Conversely, a soft inflation reading could allow a relief bounce toward $4,200–4,250, though the broader dollar trend may cap the recovery.
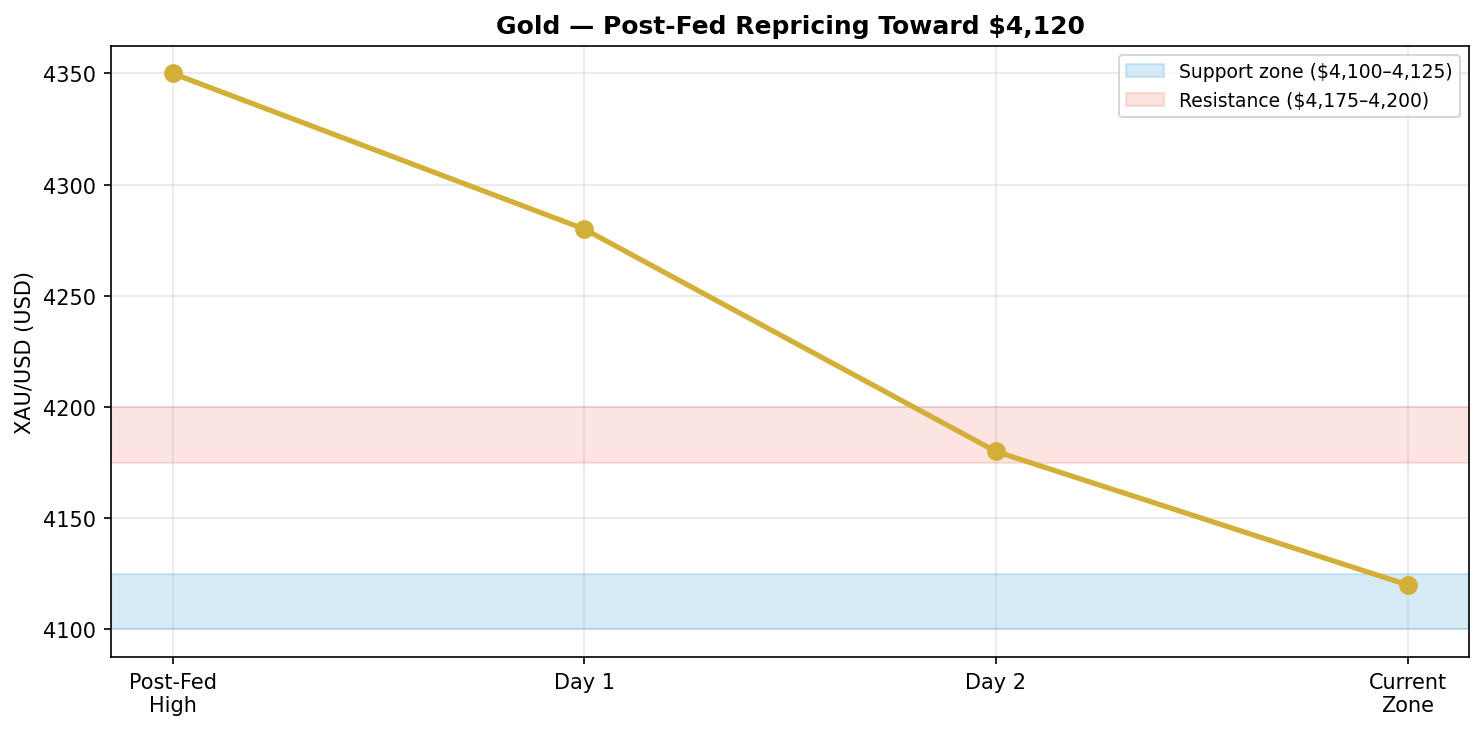
XAU/USD — post-Fed repricing toward $4,120. Source: Exness.com
US Core PCE index. Source: https://tradingeconomics.com/united-states/core-pce-price-index
News in focus this week
Wednesday, June 25: US Durable Goods Orders (May) — capex and manufacturing demand signal.
Thursday, June 26: US Core PCE (May) — the critical inflation gauge that will either validate or challenge the hawkish Fed repricing; also Final GDP (Q1).
Friday, June 27: US Michigan Consumer Sentiment (Jun, final) — late-month confidence read.
Ongoing: Samsung share buyback announcement — potential stabiliser for KOSPI and global chip sentiment.
Ongoing: Monitoring of leveraged ETF flows in South Korea — regulatory scrutiny may continue to influence retail positioning.
Now let's shift to potential scenarios and trading ideas for the week ahead, covering the aftermath of the global AI selloff and the key levels to watch in gold and equities.
XAUUSD
Gold remains in a defensive but orderly correction phase. The metal has retraced from post-Fed highs and now trades near the $4,120 participation zone, where responsive buying has emerged in prior sessions. However, the combination of a stronger dollar, rising real yields and cross-asset deleveraging keeps the near-term bias tilted lower.
A possible scenario involves a continued drift toward the $4,050–4,100 area if Thursday's Core PCE confirms sticky inflation and the equity selloff extends. The invalidation level sits above $4,200, where the 20-day moving average and prior consolidation converge. A soft PCE print could trigger a short-covering move toward that resistance, though the broader hawkish Fed narrative may limit the upside.
Given the binary nature of the inflation data this week, reducing exposure ahead of Thursday's release or shifting to a smaller timeframe may be prudent.
XAUUSD, H4 chart. Source: Exness.com
NAS100 (Nasdaq)
The Nasdaq enters the second half of the week in correction mode but not in crisis. The index is ~5.5% below its June 2 peak — a meaningful but not catastrophic drawdown by the standards of the AI rally. The key question is whether Tuesday's -2.2% drop marks the acceleration phase of the correction or the capitulation point.
A constructive scenario assumes the KOSPI rebound on Wednesday spreads positive sentiment back to US tech, with dip-buying emerging near the 21,300–21,500 support zone. Samsung's potential buyback announcement and stabilisation in Asian chip names would support this view.
The risk scenario is a hotter Core PCE print on Thursday that pushes Fed hike odds higher, triggering a second leg lower toward 20,800–21,000. In that case, the correction could deepen toward -8% to -10% from the peak — a range that has historically marked intermediate-term buying opportunities in the AI cycle, though not without further volatility.
Nasdaq Composite, daily chart. Source: Exness.com
USOIL
Brent crude has slipped below $77 as the interim US–Iran agreement reduces the geopolitical risk premium and normalises Hormuz tanker traffic. The AI selloff adds a secondary demand concern, as weaker equity sentiment often correlates with softer near-term commodity demand expectations.
If the peace framework holds, oil may continue to drift toward the $72–75 area. A renewed escalation — or a stronger-than-expected PCE print that reignites inflation fears — could provide a floor near $75–77. The asset remains sensitive to both geopolitical headlines and the macro data flow this week.
USOIL, daily chart. Source: Exness.com
Disclaimer: This material is for informational and analytical purposes only. It does not constitute investment advice, a recommendation, or a solicitation to trade. Financial markets involve substantial risk of loss. Past price behaviour and scenario analysis do not guarantee future results. All trading decisions remain the sole responsibility of the reader.