31 August 2026
August highlights: Monthly recap
August was the month the bond market took the wheel. The equity story, the gold story and the dollar story all ended up being downstream of one thing: the long end of the sovereign curve repricing to levels most traders have not seen in their careers.
The month opened with a labour shock. July nonfarm payrolls fell by 23,000 against a +80,000 forecast, and revisions to May and June removed a further 103,000 jobs. Unemployment held at 4.1%, but only because participation slipped to 61.4%. Probabilities of a September rate hike dropped from around 58% to roughly 42%, yields fell, and gold jumped to about $4,348 in its best week in seven months. The S&P 500 closed at a record 7,757.64.
The inflation data that followed pointed the same way. July CPI rose 0.1% month-on-month and 3.4% year-on-year, both in line. Core CPI eased to 2.5% annually, the slowest pace since March 2021. Producer prices were flat at 0.0% against +0.2% expected. On paper that is a textbook dovish set-up: a cooling labour market and cooling inflation. The S&P 500 duly set another record on 13 August.
And yet August ended with traders pricing a rate hike, not a cut, and with the 30-year Treasury yield entering September on its worst sustained stretch since 2006. Understanding that gap is the whole point of this recap.
The long end stopped listening to the data
The disconnect exists because the long end is no longer trading the Fed's next move. It is trading supply, deficits and term premium — the extra yield investors demand simply for holding duration.
The arithmetic behind that is not subtle. Total US government debt crossed $40 trillion during August, roughly double where it stood a decade ago. July's budget shortfall came in at $432.3 billion, the widest single month since March 2021, effectively locking in a $2 trillion deficit for the fiscal year ending 30 September. On top of the government's own borrowing, corporate issuance hit a record of roughly $215 billion in the month, a large share of it raised to fund AI infrastructure. All of that paper competes for the same pool of buyers.
The 30-year yield touched 5.34% in mid-August, the highest since 2007 and within about 10 basis points of a 22-year peak. More telling than the spike is the persistence: through 31 August the 30-year had closed above 5% on 55 trading days this year, the most since 2006. It entered September at 5.27%.
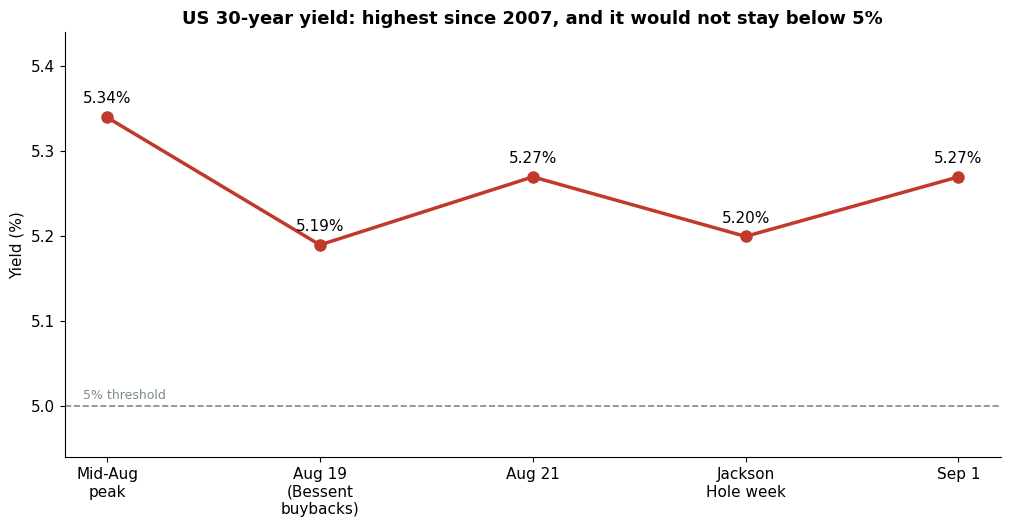
US 30-year Treasury yield through August 2026. Source: Bloomberg
The Bessent put, and where it stopped working
The clearest attempt to lean against the move came on 19 August, when the Treasury said it would at least double its liquidity-support buybacks of 10- to 30-year debt, from $2 billion to at least $4 billion per operation, beginning 9 September. Scott Bessent framed it as market-making in a thin August tape rather than quantitative easing, and later told CNBC the operations "could be more than $4 billion per issue."
The immediate reaction was textbook. The 30-year fell about 10 basis points toward 5.19%, the 10-year eased to 4.65%, the dollar weakened, and hard assets bid. Traders started calling it the "Bessent put."
It lasted about two days. By that Friday the 10-year was back at 4.73% — above its pre-announcement level — and the 30-year had returned to 5.27%. Jefferies' David Zervos described the upsized buybacks as a Treasury-led "Operation Twist" rather than QE: useful for liquidity in a quiet August, no substitute for a smaller deficit. That is the honest read. The Treasury can smooth the market's plumbing. It cannot change how much paper needs to be sold.
The repricing is global, not American
It would be a mistake to file this as a US fiscal problem. The same move happened everywhere in August, and it was still happening on the first day of September.
Australia's 10-year yield jumped roughly 10 basis points to 5.19% on 1 September, its highest since July 2011. The more policy-sensitive three-year rose 7 basis points to 4.73%. Domestic inflation and consumption data kept beating expectations, and interest-rate futures now put the odds of a 25 basis point RBA hike in November above 90%. For context on how far the cycle has travelled: the last time Australian benchmark yields traded here, the RBA cash rate was 4.75% and Europe's sovereign debt crisis was escalating. The cash rate bottomed at 0.10% in November 2020.
Elsewhere the picture rhymes. German 30-year yields reached post-2011 highs, French 30-year yields hit their highest since the global financial crisis, and Japanese 10-year yields printed a three-decade high. The common drivers are the same across all of them: rising sovereign debt loads, a wave of AI-related corporate issuance, and inflation anxiety tied to energy costs.
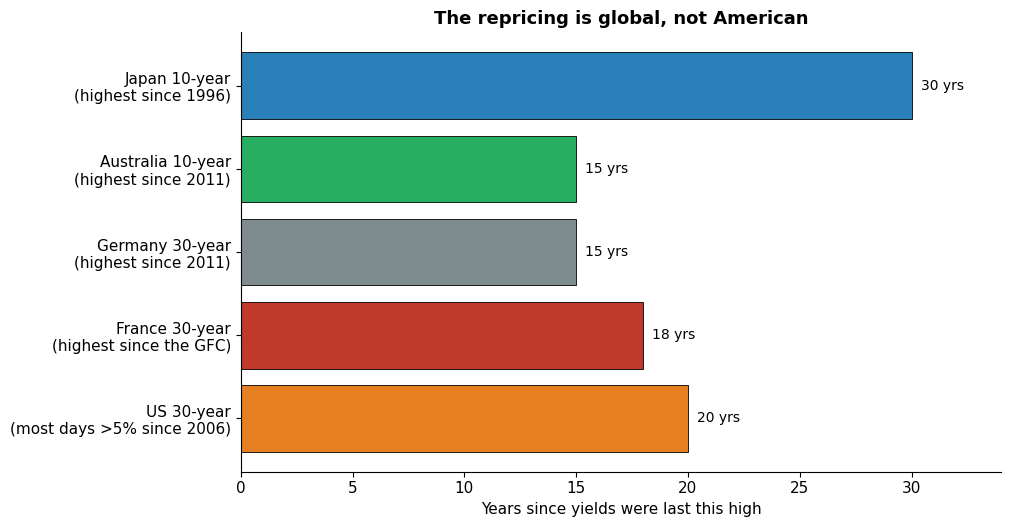
Global long-end yields — years since these levels were last seen. Source: Bloomberg / PIMCO
One caveat worth keeping in mind: even after this move, long-dated sovereign yields are roughly back at their long-run historical averages. They look extreme mainly relative to the artificially suppressed rates of the post-2008 era.
Jackson Hole flipped the script
The final week reversed the month's narrative. Kevin Warsh delivered his first Jackson Hole speech as Fed chair on 27–29 August, and it landed more hawkish than his July press conference.
He recommitted to a "firm, fixed" 2% PCE target, described short-term interest rates as the Fed's "predominant tool," and — the meaningful change — said financial conditions are not broadly restrictive. In July he had called them uneven and argued that markets had already done part of the Fed's work. The line traders took home was blunt: "We must be confident that underlying inflation is moving to our objective, clearly and at sufficient speed. Otherwise, we have work to do."
He still gave no forward guidance and no list of triggers ahead of the 15–16 September FOMC. It was enough. September hike odds jumped from roughly 36% before the speech to about 58% after it, and by 1 September swaps were pricing around 0.17 percentage points of tightening — roughly a 70% chance of a quarter-point increase. Two-year yields rose almost 12 basis points to 4.34%.
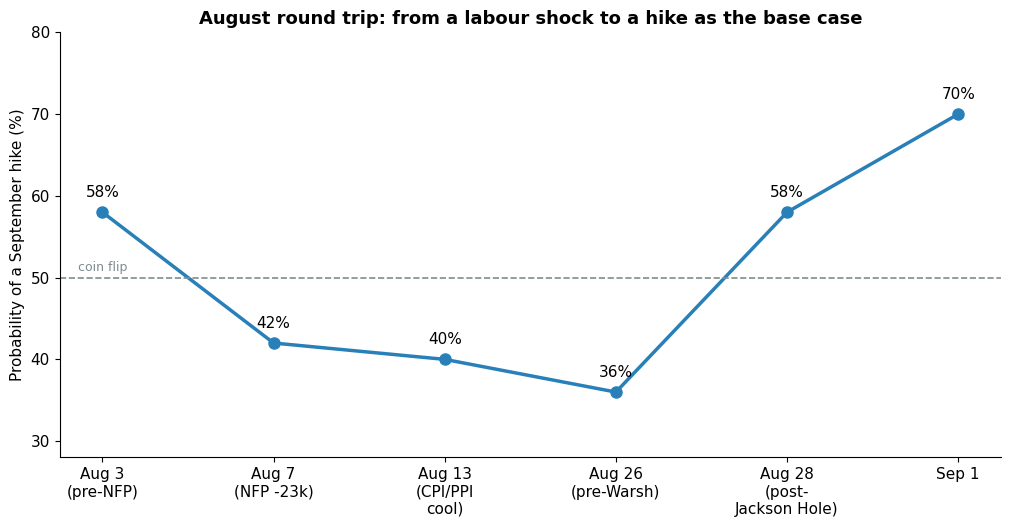
September hike probability through August 2026. Source: CME FedWatch
Conviction, though, is another matter. ABN AMRO and Brandywine both voiced scepticism that Warsh is genuinely poised to raise rates. ABN AMRO's Christophe Boucher noted that the reaction function remains unclear, and that a hold in September against still-sticky inflation would raise credibility questions — which is why he is staying away from long-dated Treasuries. Goldman Sachs warned that a hold paired with a thin explanation could whip the curve around. The market has priced a hike; it has not decided it believes in one.
Equities: two records, then a stall
US stocks spent August going nowhere expensive. The S&P 500 set a record at 7,757.64 on 7 August and another on 13 August, then ran into the long-end selloff and gave the gains back. In the week of 17–21 August the S&P fell 1.4%, the Nasdaq 2%, the Dow 0.8% and the Russell 2000 1.6%. Information technology shed more than 3% over those five days, and Nvidia closed the week on a six-session losing streak, its longest since 2022.
Nvidia's fiscal Q2 on 26 August was strong — revenue of $96.22 billion and adjusted EPS of $2.22 — and it did restart the AI bid for a session. Then PCE and Jackson Hole put duration back in charge. The month finished with the S&P around 7,712, the Nasdaq at 26,402 and the Dow roughly where it started. Net of a record high and a drawdown, August was close to flat.
What moved underneath the index level was rotation, and it was consistently away from stretched tech and toward assets that benefit from fiscal stress. During the yield-stress weeks, crypto-linked names led (Robinhood +13.7% and Coinbase +8.2% in a single session), gold miners followed the metal (Freeport-McMoRan +7.6%, Newmont +3.1%), and healthcare had its best week since late June on Moderna and Merck's late-stage melanoma data. On the other side, Walmart had one of its worst weeks since 2022.
The structural point for September: the index is now more sensitive to the 30-year than to the earnings calendar. Nvidia beat and the Nasdaq still could not hold a bid.
Gold and bitcoin: the hard-asset month
Gold had a strong August and gave back its last leg. The metal broke above its seven-week high near $4,271 on the NFP shock and closed that week around $4,348, up 2.4%. It then spent the middle of the month in a range between roughly $4,350 and $4,450, spiking toward $4,440 on the CPI print without extending. The Bessent announcement broke the range: gold pushed through $4,500 and on toward $4,580–4,600, a three-month high. Jackson Hole took it back to about $4,460.
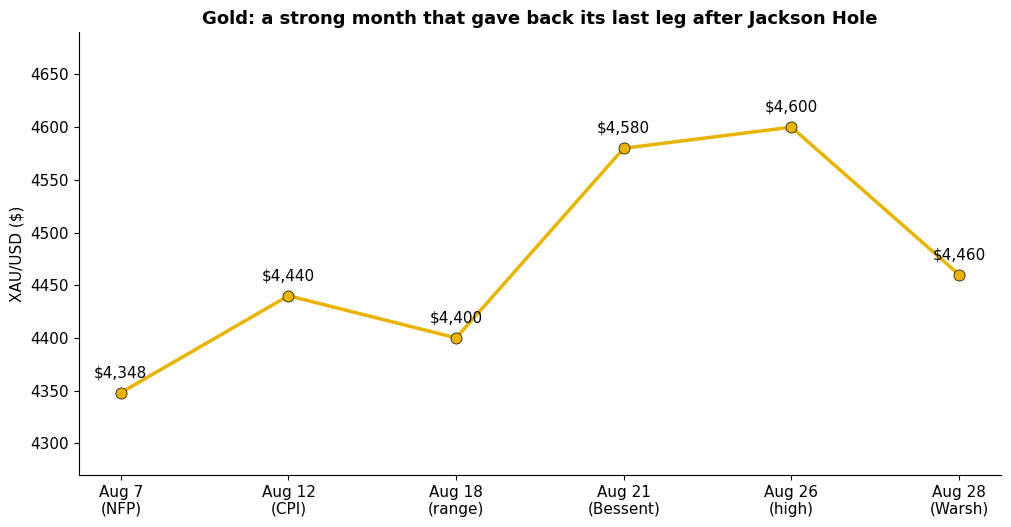
XAU/USD through August 2026. Source: Bloomberg / Exness.com
Bitcoin was the louder version of the same trade. It gained roughly 22% in the Bessent week and traded above $77,000. That it rallied hardest in the exact window when Washington signalled willingness to support the long end is the tell. Bitcoin is currently trading the fiscal-debasement theme more closely than it is tracking the Nasdaq — it held up while the Nasdaq was in a five-day slump.
Geopolitical dynamics
Energy stayed an active inflation input all month, which is part of why the curve could not rally on soft data.
Early in August, hopes for a US–Iran arrangement on the Strait of Hormuz faded when Iranian state media published a restrictive draft plan banning US and Israeli vessels, with penalties of up to 20% of cargo value. Brent rebounded nearly 4% to $82.48. Traffic through Hormuz stayed constrained through the month, and by 21 August Brent settled at $92.67. Bessent held a press conference on 24 August announcing a new Iran sanctions package, and the month closed with fresh US–Iran fighting pushing oil back above $90.
Roughly a $10 move in Brent over four weeks, in the direction that makes a central bank nervous. For a Fed chair who has just said inflation remains the job, that is not a helpful backdrop — and it is one of the reasons the long end kept selling even on the days when the labour data looked weak.
News in focus
Friday, 4 September: August nonfarm payrolls — the last labour print before the FOMC. Consensus around +58,000, unemployment 4.1%.
Tuesday, 9 September: the Treasury's enlarged long-end buybacks begin.
Friday, 11 September: August CPI — the last inflation reading before the decision.
15–16 September: FOMC. A quarter-point hike is now the base case at roughly 70%.
November: RBA meeting, with futures pricing above 90% odds of a 25 basis point hike.
Ongoing: US–Iran and the Strait of Hormuz, with Brent above $90.
Now let's break down some key opportunities of the upcoming period, starting with gold.
Gold
XAUUSD enters September near $4,460, having given back the extension from $4,600. The constructive case needs Friday's payrolls to disappoint and two-year yields to fade from 4.34%. That would rebuild the move toward $4,500–4,550 and then back to the August high at $4,600–4,650. Without it, the first support is the mid-August pause at $4,400–4,350, and below that the early-August breakout zone at $4,280–4,320.
The structural argument has not gone anywhere. Forty trillion dollars of debt, a $2 trillion annual deficit, a synchronised global long-end repricing and central banks that may have to tighten into softening labour markets describe the environment gold has rallied in all year. The tactical argument points the other way: an actual September hike lifts real yields and the dollar, and Jackson Hole ended the simple "Treasury backstop equals higher gold" trade.
For direction over the next few weeks, the two-year is the more useful gauge than the 30-year.
XAUUSD, daily chart. Source: Exness.com
Nasdaq (USTEC)
The Nasdaq sits at 26,402, between the 26,000–26,200 support that held through the August drawdown and the 26,600–26,800 supply zone that has capped every rally since the July de-rating. It has been range-bound for a month, and the range has held through an NFP shock, two records, a bond rout and a Nvidia beat.
The constructive scenario is a soft payrolls print that pushes hike odds back below 50%, allowing a grind toward 26,600–26,800 and potentially 27,000. The risk scenario is a hot jobs or CPI number, or a fresh push in the 30-year — the options market already carries bets on a 5.7% 30-year yield by 20 November — which would open 25,500–25,800.
Nvidia's quarter answered the earnings question and the index still could not rally. That is the important signal: the constraint is the discount rate, not the fundamentals.
USTEC, daily chart. Source: Exness.com
AUDUSD
The Australian dollar is the cleanest way to express the global bond story. AUDUSD is trading around 0.7170, with resistance at the recent 15-week top of 0.7208 and the May peak at 0.7277, and it has been holding near multi-month highs even as the global bond selloff deepened.
The rate-differential argument is supportive. Australian 10-year yields at 5.19% are the highest since 2011, domestic inflation and consumption keep beating, and a November RBA hike is more than 90% priced. A clean break above 0.7208 opens the path toward 0.7277.
There are two offsets worth respecting. First, a September Fed hike is now largely priced on the dollar side, so the differential is not one-way. Second, the Australian dollar remains a risk proxy — a global equity drawdown driven by the same rising yields tends to hurt it regardless of the rate story. A hawkish Fed combined with a risk-off tape would pull it back toward 0.7080–0.7120.
AUDUSD, daily chart. Source: Exness.com
Bitcoin
BTCUSD traded above $77,000 after gaining roughly 22% during the Bessent week, which made it August's strongest expression of the hard-asset trade. The behaviour worth noting is when it rallied: precisely as Washington signalled it would lean against the long end, and while the Nasdaq was still in a five-day slump.
If the fiscal theme stays dominant through September — with buybacks starting on the 9th and the deficit unchanged — that correlation argues for continued relative strength. The counter-argument is that an actual Fed hike is a liquidity tightening, and bitcoin has historically not performed well into those. Crypto-linked equities such as Coinbase, Robinhood and Strategy amplify the move in both directions, so they are a reasonable early read on where sentiment is heading.
BTCUSD, daily chart. Source: Exness.com
Disclaimer: This material is for informational and analytical purposes only. It does not constitute investment advice, a recommendation, or a solicitation to trade. Financial markets involve substantial risk of loss. Past price behaviour and scenario analysis do not guarantee future results. All trading decisions remain the sole responsibility of the reader.