9 July 2026
Escalation intensifies — second night of strikes sends oil toward $80, gold to one-week lows
The current week in the financial markets has entered a new and more dangerous phase. What began on Wednesday, July 8, as a single-day flare-up in the US–Iran conflict has evolved into a second consecutive night of military exchanges across the Persian Gulf — with larger-scale strikes, broader regional retaliation and a market repricing that shows no sign of reversing.
Overnight into Thursday, July 9, the US launched a fresh wave of airstrikes against approximately 90 Iranian targets, while Iran responded by targeting US military positions in Bahrain, Kuwait and Qatar — with air-raid sirens sounding at least three times in Bahrain, home to the US Navy's 5th Fleet headquarters. President Trump declared the interim ceasefire "over", threatened that attacks "could get much worse", and renewed warnings about striking Kharg Island — the hub that handles roughly 90% of Iran's crude exports.
Markets have absorbed the escalation in real time. Oil surged nearly 5% on Wednesday and continued higher overnight, with Brent approaching $79 per barrel. Gold fell to a one-week low near $4,056, Treasury yields held near multi-week highs at 4.57% on the 10-year, and risk appetite has still not turned back — equities and bonds remain under pressure as traders brace for a hawkish Fed and a hot inflation path.
Second night of strikes: a playbook, not a one-off
The critical shift overnight is that markets are no longer pricing a punitive one-day response — they are pricing an escalation cycle. As FXStreet noted, one strike can be treated as punishment; a second strike starts to look like a playbook. Once Washington commits to degrading Iran's ability to threaten Hormuz navigation on consecutive nights, crude stops trading off inventories alone and begins trading the reaction function: Iran tests shipping → the US responds → insurance costs rise → the barrel carries a higher political charge.
Thursday's US strikes appeared larger in scope than Wednesday's opening salvo. CENTCOM confirmed hits on military targets along Iran's coastline, including air-defence systems, coastal surveillance assets, missile and drone storage sites, naval capabilities and military logistics infrastructure. Iranian state media reported explosions in Bushehr (near the nuclear power plant complex), Chabahar, Konarak, Bandar Abbas and Sirik — key southern port cities.
Iran's retaliation expanded geographically. Beyond Bahrain and Kuwait — which were hit on Wednesday — Qatar was drawn into the exchange overnight, broadening the conflict footprint across the Gulf Cooperation Council states that host major US military installations.
Trump's rhetoric added another layer of uncertainty. Speaking after leaving the NATO summit in Turkey, he described Iran as "evil, sick people" and posted videos of explosions on social media. He explicitly warned: "If it happens again, it will get much worse!" — referring to Iranian attacks on commercial vessels. At the same time, he acknowledged that Iran had called and wanted a deal, though he questioned whether Tehran was capable of honouring one. For markets, that is not a clean off-ramp — it is a negotiation channel wrapped in mistrust, which caps panic but does not erase the premium.
Washington also revoked the licence allowing Iran to sell oil in US dollars under the interim agreement — reinstating full sanctions and removing the 60-day sanction-free window granted late last month. The Treasury move, combined with military operations, represents a return to simultaneous military and economic pressure on Tehran.
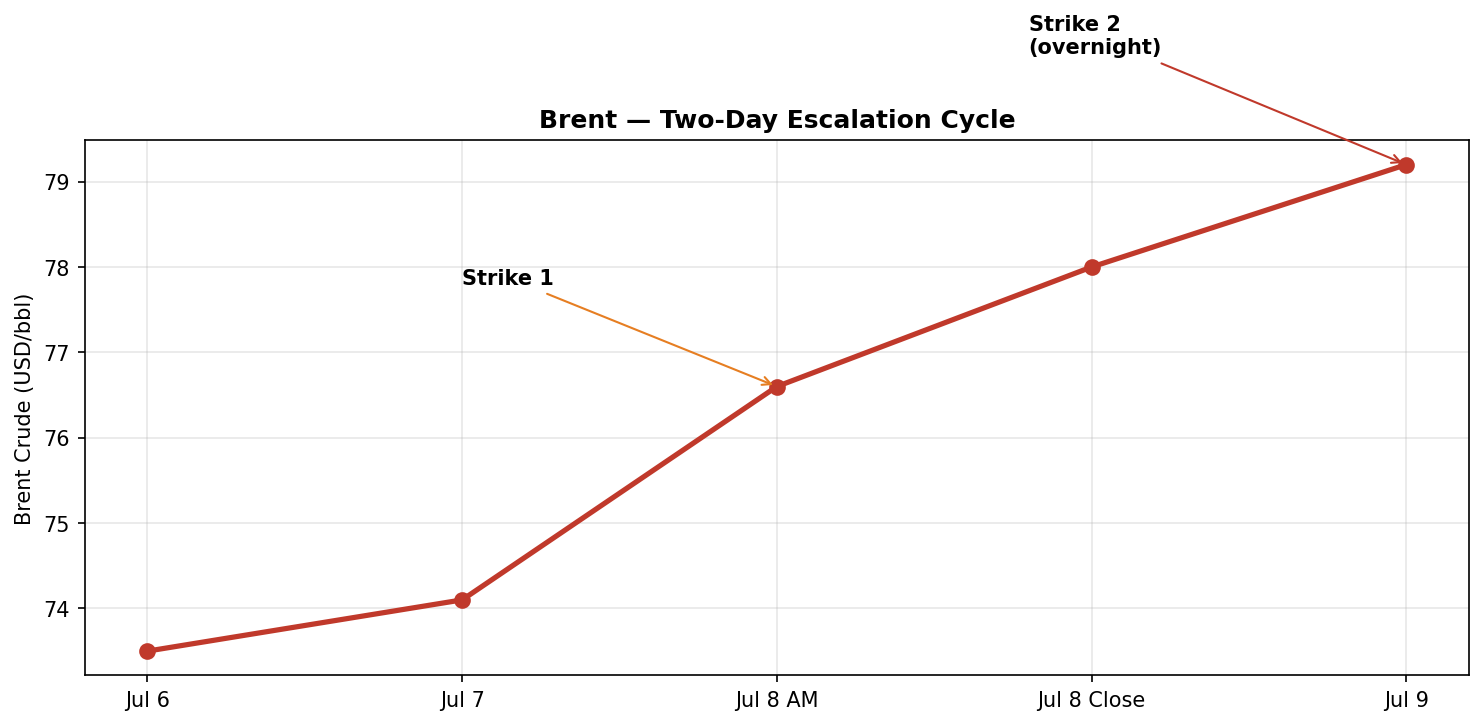
Brent Crude — two-day escalation cycle, July 8–9, 2026. Source: Reuters / market data
Strait of Hormuz shipping traffic. Source: https://www.marinetraffic.com/
Oil soars toward $80 as Hormuz risk returns
Energy markets have repriced sharply. Brent crude settled nearly 5% higher on Wednesday, reaching approximately $78 per barrel, while WTI gapped above $75 in the NYMEX night session before consolidating. By Thursday's Asian session, Brent was pressing toward $79 as the second night of strikes confirmed the escalation cycle.
The move represents a complete reversal from the post-ceasefire narrative that had anchored crude near $72–74 just days earlier. Traders who had been positioned for a supply glut — after OPEC+ quota increases and Middle Eastern output normalisation — were forced to unwind quickly as Hormuz re-entered the centre of the oil trade.
The supply-side risk has multiple layers:
- Shipping disruption: Roughly one-fifth of the world's traded oil and gas transits Hormuz. During the peak of the conflict in March–April, Brent exceeded $120.
- Kharg Island threat: Trump has renewed threats to seize or strike Kharg Island, which handles ~90% of Iran's crude exports. FXStreet flagged this as the line between harassment and operational risk.
- Sanctions reinstatement: Revoking the oil-sales licence removes Iran's legal export channel, even as Tehran had insisted on controlling vessel routes and charging passage fees.
- Depleted SPR: US Strategic Petroleum Reserve stocks have fallen to their lowest level since 1983, leaving limited buffer capacity.
European energy stocks partially offset broader index weakness on Wednesday — the STOXX 600 fell -1.1% despite gains in oil-and-gas names. MUFG's Lee Hardman noted the dollar is benefiting from the energy-inflation-rate-hike linkage: "If energy prices go higher, and that means inflation goes higher, then we're more likely to get rate hikes, benefiting the dollar."
Gold plummets to one-week lows — macro channel dominates
Gold (XAU/USD) extended its decline overnight, falling -0.3% to -0.5% to trade near $4,056–4,066 per ounce — the lowest level since July 1. US gold futures for August delivery slipped to approximately $4,077.
The overnight move confirms that gold is trading the macro repricing channel, not the geopolitical hedge channel. Despite escalating military conflict, the metal continues to fall because:
- Higher oil → higher inflation expectations → hawkish Fed pricing
- Stronger US dollar on the energy-rate-hike linkage
- Rising real yields making non-yielding assets less attractive
- Cross-asset deleveraging — investors cutting gold to cover losses elsewhere
Bank of America cut its 2026 average gold forecast by 14% to $4,360 per ounce, citing a more hawkish Fed — a notable institutional downgrade that reinforces the bearish near-term narrative. The IMF also lowered its 2026 global growth forecast to 3%, adding to the headwind for commodity demand expectations.
Support now sits near $4,050–4,075, with a break below $4,050 opening the path toward $4,000. Recovery above $4,150 would require either a rapid de-escalation or a dovish surprise — neither appears likely in the current environment. Prithviraj Kothari of RiddiSiddhi Bullions noted that both gold and silver had rallied sharply over the prior week and could see a short-term correction before any broader uptrend resumes.
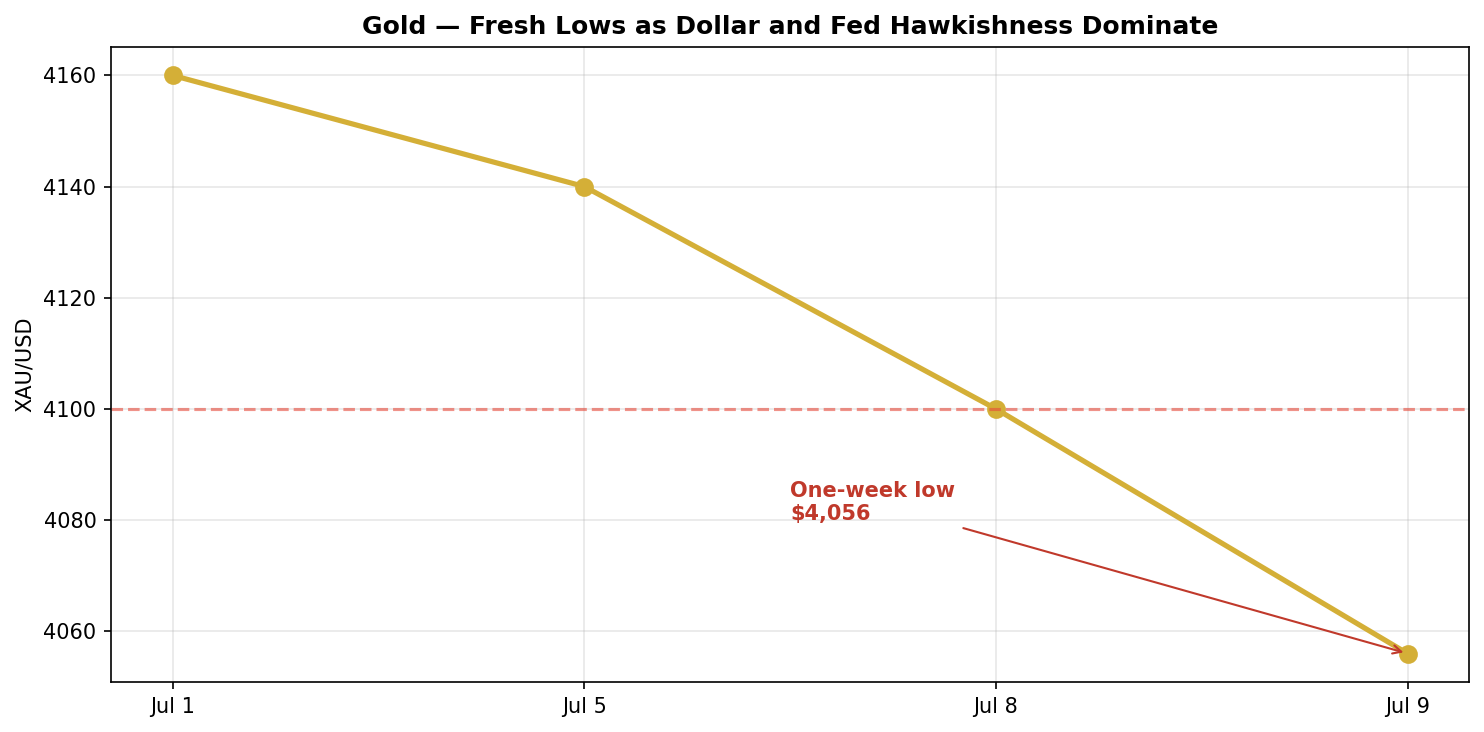
XAU/USD — one-week low near $4,056, July 9, 2026. Source: Exness.com
Fed minutes confirm division — hawkish tilt reinforced overnight
The FOMC June meeting minutes, released Wednesday at 2:00 p.m. ET, landed in the middle of the geopolitical shock — and markets read them as reinforcing the hawkish path, even as Wall Street debated the nuances.
Key takeaways from the first minutes under Kevin Warsh's chairmanship:
- The Committee was deeply divided: "many" officials saw rates unchanged or lower by year-end, but "many" also saw rates higher — an evenly split debate with no clear consensus.
- A few officials believed there was "a case for raising" rates at the June meeting itself, though the vote to hold at 3.50–3.75% was unanimous.
- AI-related inflation featured prominently — the minutes contained 20 mentions of AI, most linked to upward pressure on prices for semiconductors and technology goods.
- Officials flagged scenarios where inflation "would remain elevated due to strong AI-related demand, the conflict in the Middle East, or the effects of tariffs" — in such cases, "almost all participants indicated that some policy firming would likely be warranted."
- Warsh dropped forward guidance and shortened the FOMC statement to a single page focused on "delivering price stability."
Market repricing after the minutes was swift. CME FedWatch now shows ~30.5% odds of a July hike (up from 27% on Tuesday) and ~70% odds of a hike by the September meeting (up from 62%). The expected timing of the first hike was pulled forward from December to October. Markets assign ~85% odds of at least one hike by year-end and ~46% odds of more than one.
On Thursday morning, Treasury yields stabilised near the spike highs rather than reversing: the 10-year held at 4.5732%, the 2-year at 4.1953%, and the 30-year rose 1bp to 5.0773% — holding above the psychologically important 5% level. The lack of a yield pullback despite steady rather than rising prices suggests markets are holding the inflation-risk premium, not fading it.
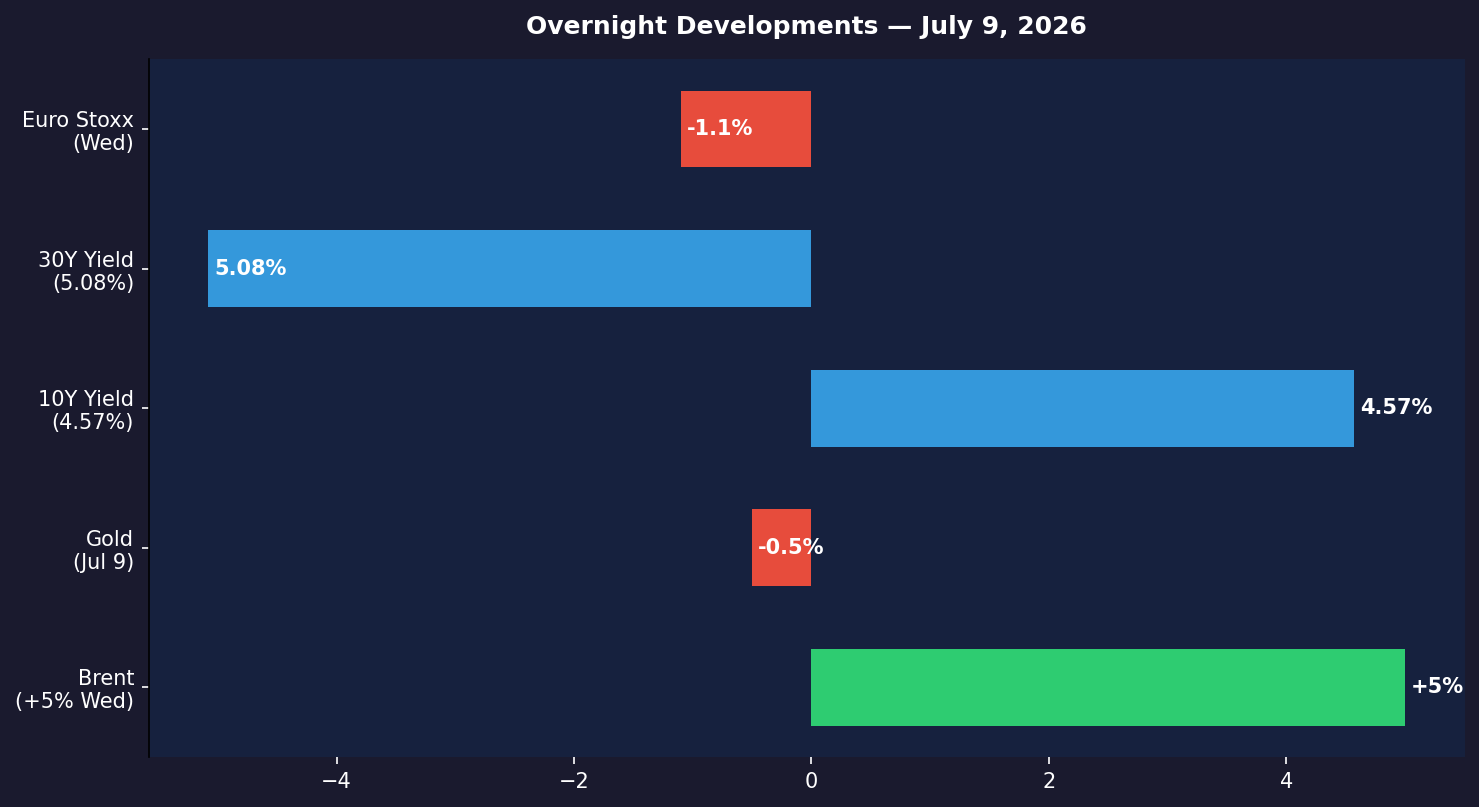
Cross-asset snapshot — overnight developments, July 9, 2026. Source: CNBC / Reuters
CME FedWatch Tool. Source: https://www.cmegroup.com/markets/interest-rates/cme-fedwatch-tool.html
US 10-year Treasury yield. Source: https://www.tradingview.com/symbols/TVC-US10Y/
Risk appetite has still not turned back
The overnight session offered no relief for equity markets. The combination of military escalation, oil above $78, gold at one-week lows and yields near highs has kept the risk-off regime intact.
European stocks dropped -1.1% on Wednesday, with the DAX, CAC 40 and FTSE all closing lower. US stock futures remained soft, and Asian markets showed no decisive recovery — the KOSPI and Nikkei continue to trade under pressure from the dual AI-correction and geopolitical headwinds that have dominated since late June.
Edward Jones strategist Angelo Kourkafas offered a measured view: the spike in oil and yields drove a near-10% correction in the first half of the year, but the economy showed resilience to those shocks. He argued that investors may not react to this round of uncertainty in the same way — partly because oil at ~$78 remains well below the $120 peaks seen during the height of the conflict. That framing may explain why the VIX has not yet reached panic levels, even as the Fear & Greed Index continues to drift toward fear territory.
Nevertheless, the market retains a relatively short-term scope. Big money appears to be waiting for clarity on whether the escalation cycle continues or whether Trump's acknowledgment of Iranian outreach translates into a diplomatic off-ramp. Until then, rotational selling across tech, cyclicals and EM assets remains the dominant flow.
Fear-and-greed index from CNN. Source: https://edition.cnn.com/markets/fear-and-greed
News in focus this week
Thursday, July 9: US Initial Jobless Claims — labour market pulse; Existing Home Sales (June) — housing demand read.
Friday, July 10: US Consumer Credit (May) — household borrowing trends.
Monday, July 14: US CPI (June) — the critical inflation print; energy pass-through from the oil surge will be the dominant market input.
Tuesday, July 15: US PPI (June) — secondary inflation gauge.
Ongoing: Second-night escalation cycle — whether US strikes continue and whether Iran expands retaliation beyond the Gulf states.
Ongoing: Kharg Island and Hormuz shipping — any targeting of Iran's primary export hub or further tanker attacks would trigger another leg higher in crude.
Ongoing: Iranian diplomatic outreach — Trump acknowledged Tehran wants a deal; markets will watch whether back-channel talks produce a de-escalation headline.
Now let's shift to potential scenarios and trading ideas for the week ahead, covering the intensified escalation landscape and the key levels across oil, gold and equities.
USOIL
Crude oil has shifted into a sharper, more tactical regime. Brent has moved from $72–74 to $78–79 in two sessions, and the second night of strikes confirms this is an escalation cycle rather than a one-day event.
A possible scenario involves a continued push toward $82–85 if a third round of strikes occurs or if Kharg Island is targeted. WTI has already gapped above $75 and may follow Brent toward $80. The invalidation level sits near $74–75, where Wednesday's opening gap would need to be fully filled. A diplomatic de-escalation headline — even partial — could trigger a sharp unwind toward that zone, though Trump's mixed messaging makes such a headline unpredictable.
Given the binary nature of military headlines and the depleted SPR buffer, reducing exposure ahead of the CPI print on July 14 remains prudent.
USOIL, daily chart. Source: Exness.com
XAUUSD
Gold is trading near $4,056 — a one-week low — and the asymmetry continues to favour the downside. The BofA forecast cut and the Fed minutes' hawkish tilt reinforce the bearish near-term narrative, while the dollar-and-yields channel overwhelms any geopolitical hedge bid.
A possible scenario involves a continued drift toward $4,000–4,025 if oil holds above $78 and Thursday's jobless claims do not signal labour-market weakness that would soften hike expectations. Responsive buying may emerge near $4,000, a psychologically important round number. Recovery above $4,150 would require a de-escalation headline or a soft CPI on July 14.
Silver has held comparatively steady despite gold's weakness — a potential divergence worth monitoring if gold stabilises while silver leads a metals recovery.
XAUUSD, H4 chart. Source: Exness.com
NAS100 (Nasdaq)
The Nasdaq remains under dual pressure: the AI valuation correction from late June and the macro headwind from oil-driven inflation and hawkish Fed repricing. The FOMC minutes confirmed that AI infrastructure investment is now an explicit inflation concern for the Committee — directly linking the index's primary growth narrative to the policy headwind.
A constructive scenario requires a diplomatic de-escalation that pulls oil back below $75 and allows yields to ease. In that case, dip-buying may emerge near 21,000–21,200. The risk scenario — currently more probable — involves Brent holding above $78, September hike odds remaining above 65%, and the index drifting toward 20,500–20,800 ahead of the July 14 CPI.
The FOMC minutes have been digested; the next major catalyst is jobless claims today and CPI on July 14.
Nasdaq Composite, daily chart. Source: Exness.com
Disclaimer: This material is for informational and analytical purposes only. It does not constitute investment advice, a recommendation, or a solicitation to trade. Financial markets involve substantial risk of loss. Past price behaviour and scenario analysis do not guarantee future results. All trading decisions remain the sole responsibility of the reader.