24 July 2026
Oil back above $100, Nasdaq sinks 2% — earnings fail to calm a fragile market
The week of July 14–24 in the financial markets has traced a full narrative arc: from CPI-driven relief and record bank earnings, through an AI rotation that punished even blowout semiconductor results, to a Thursday capitulation that sent the Nasdaq down more than 2%, Brent crude back above $100 per barrel, and the Magnificent Seven through a $767 billion single-day wipeout. As Bloomberg noted in its markets wrap, stocks mirrored cautious moves across asset classes as traders questioned whether earnings justified further advances in the AI trade — while uncertainty swirled around the Middle East.
The market's equilibrium, which had appeared stable near record highs just days earlier, has proved fragile. Good macro news and strong corporate results were not enough to sustain the rally when oil reignited inflation fears and megacap tech companies reported negative free cash flow alongside soaring AI capital expenditure.
Earnings season: strong numbers, harsh reactions
Q2 earnings season has delivered a paradox that defines the current market regime: results are fine, but fine is not enough for the most crowded and expensive names.
Banks: beats confirmed, reactions diverged
The week opened with a powerful bank earnings cluster on Tuesday, July 14, coinciding with the soft CPI print:
| Bank | Highlight | Initial reaction |
|---|---|---|
| Goldman Sachs | Record Q2, EPS $20.98 vs $14.47 expected | +9.0% (best day since tariff extension rally) |
| JPMorgan | Record net income $21.2B, +41% YoY | +2.5% |
| Bank of America | Trading revenue +33% to record $7.1B | +1.9% |
| Citigroup | Profit +61% YoY | -5.8% (expenses concern) |
| Wells Fargo | Solid beat | -3.3% |
The pattern was consistent: banks with the strongest capital-markets recovery (Goldman, JPM) were rewarded on the day, while those where beats were already priced in (Citi, WFC) sold off. By week-end, Goldman's initial +9% surge had faded to roughly +0.9% for the week — confirming the report rather than creating a new thesis.
TSMC and Netflix: two ways to get sold
Thursday, July 16 brought two marquee prints within hours of each other — and both were punished:
- TSMC reported record Q2 profit +77.4% YoY to ~$22 billion, raised full-year revenue growth guidance to above 40%, and announced an additional $100 billion US fab investment. The stock fell ~3%. The market read the raised capex as evidence the industry may be building ahead of demand.
- Netflix delivered in-line Q2 EPS ($0.80) but guided Q3 revenue below consensus ($12.86B vs $13.0B expected) and announced it would reduce engagement reporting from semi-annual to annual. The stock fell ~7–9%, extending its YTD decline toward -21%.
The SOX semiconductor index approached correction territory (-20%) from recent highs by Friday, July 18, as the selloff circled the globe — Taiwan's market dropped -6.5%, Japan's Nikkei -4%.
Alphabet and Tesla: the Mag 7 reckoning
The week's heaviest blow landed on Wednesday–Thursday, July 23, when the first Magnificent Seven earnings confirmed the market's worst fears about AI spending sustainability:
Alphabet (GOOGL):
- Revenue grew +24%, cloud surged +82% to $24.8B — largest quarterly cloud growth in company history.
- Yet capex reached $44.9B, exceeding $39.1B in operating cash flow → negative free cash flow of -$5.9B.
- Raised 2026 capex guidance to $195–205 billion (from $180–190B). Contractual obligations surged ~$500B vs Q1 end.
- Stock: -7.2%, wiping ~$300 billion in market cap.
Tesla (TSLA):
- Revenue grew +26% but adjusted EPS missed estimates.
- Capex more than doubled; negative free cash flow for the first time in over two years (-$1.1B).
- Automotive gross margin 16.3%, below expectations.
- Stock: -14.5% — worst day since March 2025, losing ~$200 billion in market cap.
Combined, the Magnificent Seven lost $767 billion in a single session — the largest one-day drop since Trump's tariff tantrums in April 2025. Amazon fell -4.6% (-$120B) on sympathy. Only Apple emerged as an unlikely winner, up +11% for the month as investors rotated toward cash-generative platform names over capex-heavy AI spenders.
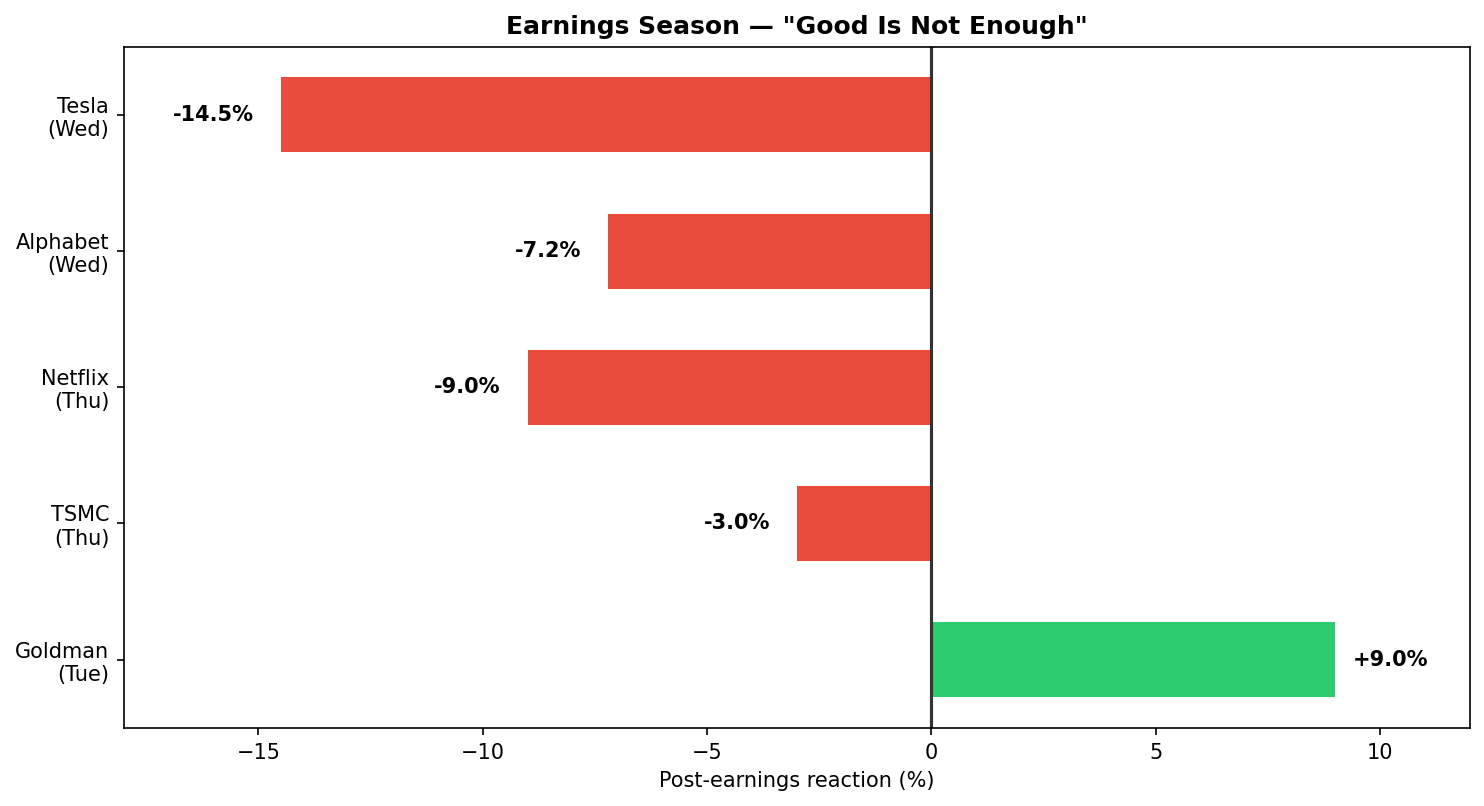
Post-earnings stock reactions — week of July 14–23, 2026. Source: Bloomberg / market data
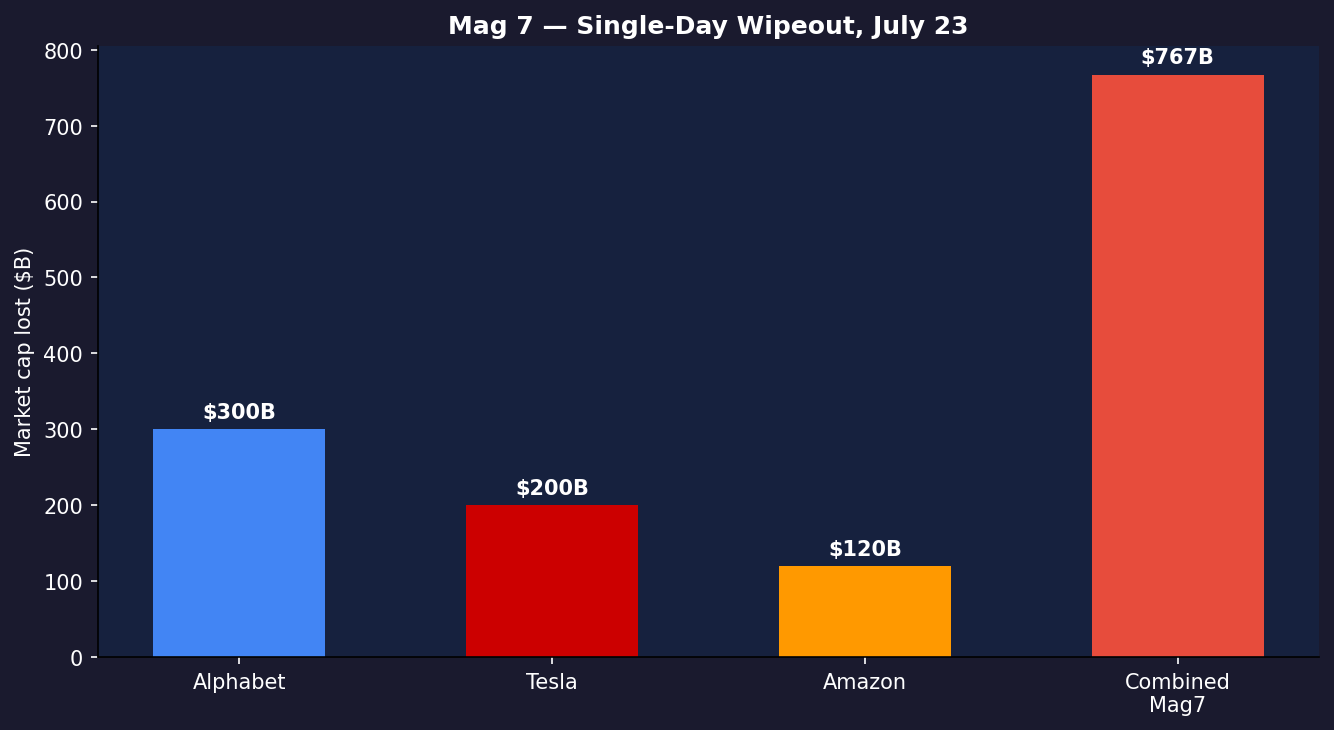
Magnificent Seven — market cap lost on July 23, 2026. Source: CNBC / market data
Thursday, July 23: the selloff day
The confluence of $100 oil and AI cash-burn fears produced the week's worst session:
| Index | Change | Close |
|---|---|---|
| Nasdaq Composite | -2.15% | 25,137.69 |
| S&P 500 | -1.21% | 7,408.30 |
| Dow Jones | -0.97% (-507 pts) | 51,711.65 |
It was the worst one-day performance for the S&P and Nasdaq since June 23. The Dow recorded its fifth negative day in six sessions. For the week through Thursday, the Nasdaq was down -1.5%, the S&P -0.7%, and the Dow -0.8%.
Declining issues outnumbered advancers 2.99-to-1 on the NYSE. The Magnificent Seven index sat -11% below its late-May record high, having shed over $2 trillion in market capitalisation from the peak.
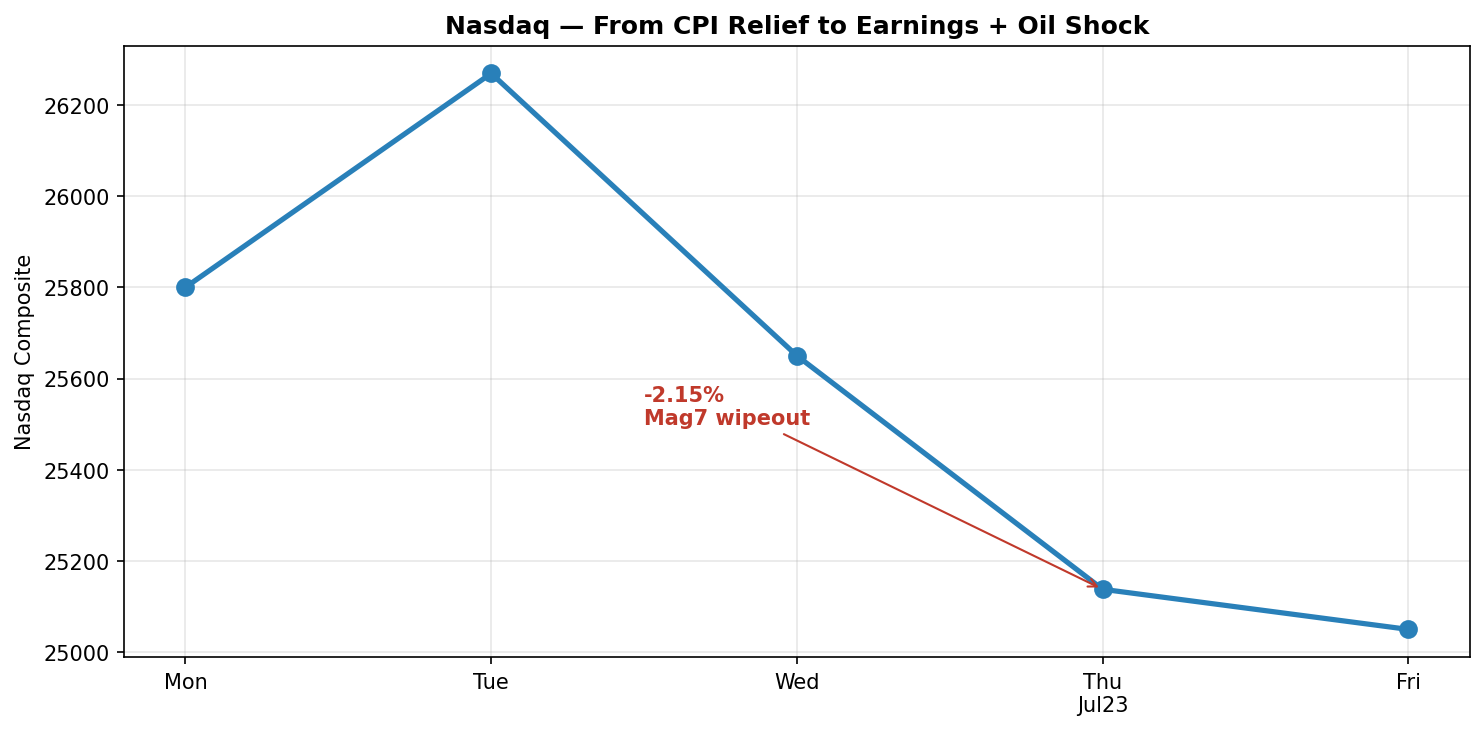
Nasdaq Composite — week of July 14–24, 2026 (schematic). Source: Bloomberg
Oil and the Strait: a dual chokepoint crisis
The geopolitical backdrop escalated dramatically this week, transforming oil from a background risk into the session's primary driver.
Hormuz: effectively closed
The Strait of Hormuz — through which roughly one-fifth of the world's traded oil and gas passes — remains effectively shut since the US–Israel war on Iran began in late February. Iran's Revolutionary Guards claim full control of the waterway, warning that no tanker may enter or leave without coordination with Tehran. The US has conducted 13 consecutive nights of strikes on Iran (as of July 23), targeting maritime capabilities, missile storage and coastal surveillance sites, while pushing to restore freedom of navigation.
Red Sea: a new front opens
The critical escalation this week came from the Red Sea. On Wednesday, Iran-backed Houthi rebels in Yemen claimed attacks on two Saudi oil tankers — Encelia and Layla — in the Bab el-Mandeb Strait. Five Saudi tankers reversed course following a Houthi-declared maritime embargo targeting Saudi ports.
The Red Sea route had served as a relief valve for Gulf exporters, allowing Saudi Arabia and the UAE to bypass Hormuz via pipelines to ports on the Red Sea coast — roughly 6.8 million barrels per day, about half of normal Hormuz volumes. With both chokepoints now under pressure, the market is pricing a dual blockade scenario.
$100 oil returns
Brent crude surged +6.45% on Thursday to $101.10 per barrel — the first close above $100 since late May. WTI advanced +5.37% to $91.49. Brent has rallied more than 30% in July alone.
Goldman Sachs warned Brent could exceed $120 per barrel in Q4 if Hormuz remains disrupted through next year, with Bab el-Mandeb tensions adding further upside. Rystad Energy noted that spare production capacity has been largely used, strategic petroleum reserves are depleted, and commercial inventories are lower than when the war began — leaving few buffers against prolonged disruption.
The oil spike pushed the 10-year Treasury yield above 4.70% — its highest since January 2025 — and the 2-year above 4.36%, as markets repriced inflation and Fed hike expectations.
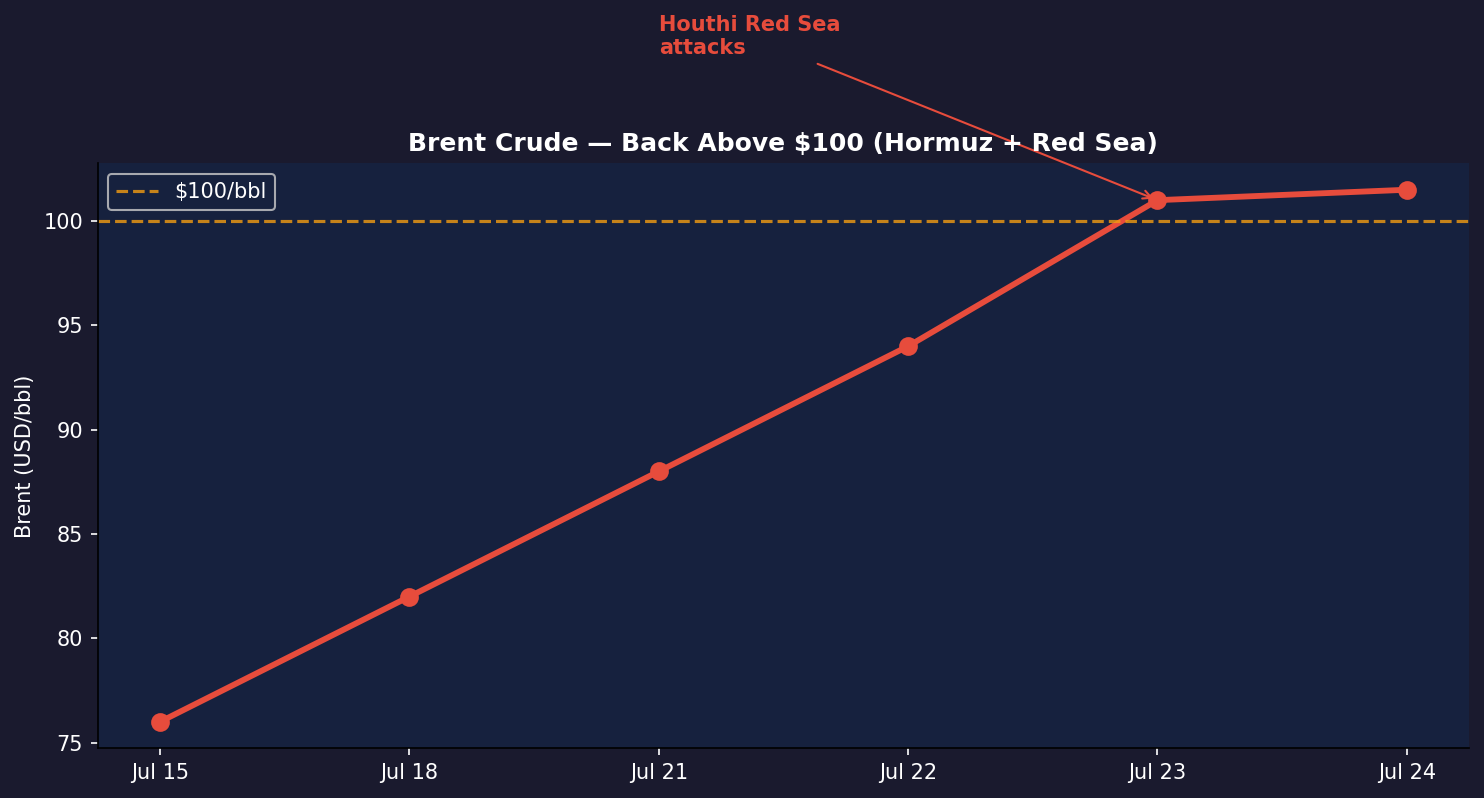
Brent Crude — dual chokepoint crisis (Hormuz + Red Sea), July 2026. Source: Bloomberg / Al Jazeera
Strait of Hormuz and Bab el-Mandeb shipping routes. Source: https://www.marinetraffic.com/
Latest Oil Market News and Analysis. Source: https://www.bloomberg.com/news/articles/2026-07-22/latest-oil-market-news-and-analysis-for-july-23
The Fed: caught between soft CPI and $100 oil
The macro picture this week has been defined by competing signals. The soft June CPI (-0.4% MoM, 3.5% YoY) and PPI (-0.3%) from earlier in the month had pushed July hike odds down to ~10%. Kevin Warsh's congressional testimony reinforced a hold-at-the-July-29-meeting consensus.
But $100 oil reintroduces the inflation channel with force. OIS markets still price ~27 basis points of tightening by year-end, and Thursday's yield spike suggests the bond market is no longer treating energy as a transitory supply shock. The July 29 FOMC meeting — now just five sessions away — faces a binary setup: hold and risk falling behind the inflation curve, or hike into a tech-led equity correction.
CME FedWatch Tool. Source: https://www.cmegroup.com/markets/interest-rates/cme-fedwatch-tool.html
US 10-year Treasury yield. Source: https://www.tradingview.com/symbols/TVC-US10Y/
News in focus — end of week
Friday, July 24: Markets digest Thursday's selloff; oil holds near $100 in Asia trading; weekly close will determine whether the correction deepens or stabilises.
Next week: Microsoft and Meta report Wednesday after close; Amazon follows Thursday — the next test of whether megacap AI spending can be justified to investors.
Ongoing: US strikes on Iran — 13th night completed; Trump threatens "biggest strikes yet" if Hormuz attacks continue.
Ongoing: Houthi Red Sea blockade — five Saudi tankers reversed course; Bab el-Mandeb risk premium embedded in crude.
July 29: FOMC rate decision — hold expected, but dot plot and Warsh press conference critical with oil at $100.
Now let's shift to potential scenarios and trading ideas for the week ahead, covering the post-selloff landscape and the dual oil-technology headwind.
NAS100 (Nasdaq)
The Nasdaq has transitioned from a CPI-driven relief rally to an earnings-and-oil-driven correction. At 25,137, the index sits -11% below its late-May peak in Mag 7 terms, with the equal-weight vs cap-weight divergence at extremes.
A constructive scenario requires oil stabilising below $95, positive Microsoft/Meta earnings next week, and a Fed hold on July 29 without hawkish surprise. Responsive buying may emerge near 24,800–25,000.
The risk scenario — supported by Thursday's price action — involves Brent holding above $100, continued Mag 7 capex scrutiny, and a hawkish Fed dot plot. That path opens 24,200–24,500, particularly if Houthi Red Sea attacks continue.
Nasdaq Composite, daily chart. Source: Exness.com
USOIL
Oil is the week's dominant macro variable. Brent at $101 reflects a dual chokepoint premium that did not exist two weeks ago. Goldman Sachs' $120 Q4 scenario is now within the market's cone of probability if both Hormuz and Bab el-Mandeb remain disrupted.
A possible scenario involves a continued grind toward $105–110 if US strikes continue and Houthi attacks escalate. The invalidation zone sits near $92–94, where pre-Red Sea-escalation consolidation had formed. Any diplomatic breakthrough on Hormuz shipping would trigger a sharp unwind — but none appears imminent.
USOIL, daily chart. Source: Exness.com
XAUUSD
Gold has been caught between $100 oil (inflationary, hawkish Fed) and equity selloff (potential safe-haven bid). After whipsawing through the earlier CPI relief rally, the metal faces renewed pressure from rising real yields above 4.70% on the 10-year.
A possible scenario involves gold stabilising near $4,050–4,100 if the equity correction deepens and triggers defensive allocation — even as the dollar remains firm on rate-hike repricing. A break below $4,050 would signal the macro channel dominating entirely. Recovery above $4,175 requires oil reversing below $95 or a dovish Fed surprise.
XAUUSD, H4 chart. Source: Exness.com
Disclaimer: This material is for informational and analytical purposes only. It does not constitute investment advice, a recommendation, or a solicitation to trade. Financial markets involve substantial risk of loss. Past price behaviour and scenario analysis do not guarantee future results. All trading decisions remain the sole responsibility of the reader.